Monday, December 16, 2013

Term Project: Land change in the Fraser Valley region of Abbotsford, British Columbia

Introduction
For my term project I chose to perform four different remote sensing techniques on landsat images of my hometown of Abbotsford, British Columbia. Which is located along the Fraser River in the province of British Columbia, Canada. This area is located in the river valley, which is commonly referred to as the Fraser Valley region and is a host to many cities and suburbs. The river valley runs from the Rocky Mountains to the Georgia Strait, and hosts British Columbia's capital city Vancouver. I chose to look at land use change in this area, by looking at three time periods: 2008, 2011 and 2013.

Methods
All images were obtained from the global viewer by the USGS or glovis. These images were imported into Erdas imagine and stacked with layer stacking to create ERDAS files. To begin my project, the first technique I chose to employ was image subset. To do this I used ArcGIS online to find a shapefile of the census regions in B.C., of which the Fraser Valley is one. I then selected Fraser Valley census region and exported its information to create a shapefile. The shapefile was quite large and covered more area than I wanted to show, so I used the editor toolbar in ArcMap and cut the shapefile in half. This shapefile was then used in Erdas Imagine to create an area of interest, which was used to create the image subset.

The next technique that I used was pan-sharpening. This technique uses a panchromatic band 8, which has a resolution of 15 m to increase the resolution of a regular multispectral landsat image, which originally has a resolution of 30 m. Erdas imagine has a specific tool to create a pansharpened output image. landsat 4 and 5 did not include a panchromatic band, so for this technique I used the recently instated landsat 8 satellite.


To see land change however I employed two specific techniques, the normalized difference vegetation index (NDVI) and binary change detection. NDVI find the areas with vegetation and makes them white or shades of grey. Using two images from different years, NDVI can be used to detect changes in vegetation. For example the next image shows a top of a hill that is favorable for subdivision expansion. In 2008, there is some expansion but the difference is visible in 2012 (view the white blotch in the middle, it has more dark areas in 2011 indicating loss of vegetation).
The final technique was binary change detection which subtracts the older year from the younger year and reclassifies the areas where change occured so it appears as white, and no change as black. This classification image was then input into ArcMap and the black made hollow and white made red, so that we can see the areas with significant change overlaid over a image of the city.


The final result is that the majority of change occured over the agricultural areas, as can be expected as farmers change out fields or let them grow fallow for the season.. Some areas near the city however are interesting and indicate urban growth, especially atop the hillls and within the city.

Sunday, December 15, 2013

Lab 5 Image mosaic and Miscellaneous image functions 2

Goals and Objectives

The purpose of this lab is to introduce analytical processes in remote sensing. The objective of this lab is to explore techniques such as RGB to IHS transformation, image mosaicking, spatial and spectral enhancement, band ratio, and binary change detection.

Part 1 RGB to IHS and back
For this part of the lab we looked at a normal RGB image and transformed it to IHS, and then back again to RGB to improve the histograms.

Part 2 Image Mosaicking.


Part 5 Binary Change Detection
Figure 1 Binary change detection output image. This image was created after running the Raster tool Functions - Two Image functions. What this does is subtracts the brightness values of an older image from that of a newer image to obtain this result.


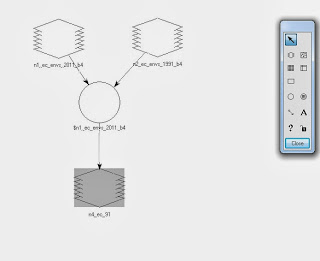
Figure 2 Model Maker to perform the same result as Figure 1

Lab 8 Spectral Signature Analysis

Introduction
For this lab we looked at the spectral signatures that objects produce, which aids in analysis. Each object reflects light in a different manner, some absorb certain wavelengths and refelect others, creating a unique signature that can be used to idenify objects. Using a landsat image of Eau Claire, we collected spectral signatures with the signature editor tool in Erdas Imagine. Tweleve signatures were collected: Standing water, moving water, vegetation, riparian vegetation, crops, urban grass, uncultivated moist soil, dry soil, rock, parking lot, asphalt highway, and airport runway.


Most plant signatures are moderate in the blue and green bands but then increases significantly in the red and near infrared bands, this allows them to absorb green light energy and reflect harmful red and near infrared light, which can cause cell damage. Water signatures are higher in the blue band but then decrease significantly in the near infrared band as it absorbs the infrared light. Rock surfaces tend to absorb red and near infrared light, but reflect blue green and red light.
 
Overall this was a very interesting lab because it shows how remote sensing analysis can be used for image classification and analysis.

Lab 7 - Introduction to Photogrammetry

Goals and Objectives
The purpose of this lab is to introduce the class to photogrammetry techniques and stereoscopy. Part one involves looking at scales and measurement as well as relief displacement, part two involves creating and looking at stereoscopic images, and part three involves orthorectification.

Part 1
For part one we looked at images of Eau Claire, WI in Erdas Imagine. Using the measurement tool and hand rulers, we measured actual images and calculated perimiter, as well as relief displacement. With displacement something like a smoke stack may appear at a more oblique view (side view), with relief displacement, we find the principle point of the image and measure to the object, calculating displacement and correcting.

Part 2
For this part we looked at stereoscopy. We created an anaglyph image of Eau Claire, which requires 3D glasses to view. Using this image we can visualize easier elevation and buildings. In order to create this image, we used a digital elevation model to produce ground control points.


Part 3
For this part of the lab we looked at orthorectification. Using Erdas Imagine Lecia Photogrammetric Suite (LPS), we created an accuate set of ground control points to rectify an image.

Sunday, November 24, 2013

Lab 6 - Geometric Correction

Goals and Objectives
The goals of this lab are to learn the different methods of image preprocessing or geometric correction. There are two main methods of geometric correction, image to map rectification and image to image registration. Part one highlights image to map rectification, using a topographic map of Chicago and the satellite image. Part two involves image to image registration using two satellite images of Sierra Leone. The goal of this exercise is to use ground control points on both sets of images to rectify the planimetric position of the study satellite image. An indiciator of high quality geometric correction is the root mean square error (RMSE). A RMSE below .05, or within half a pixel, will result in a higher quality geometric correction.

Part 1
In this part, a topographic map was created of the Chicago area and digitized to create a digital raster graphic (.drg). Digital rasters can serve as a planimetric base with which to acquire ground control points for image to map rectification. In this part's example, we are operating at a first order polynomial model. 1st order polynomial involves acquiring at least 3 ground control points in order to rectify the image. The method used to rectify the image was nearest neighbor which uses the closest pixel to estimate the brightness values of the rectified image.

Figure 1 Using Multipoint geometric correction to manually enter ground control points from a reference topographic digital raster graphic. RMSE total of .0003.
 Part 2
This part of the exercise used image to image registration to geometrically correct the image. A satellite image that was previously corrected was used to process the newly acquired satellite image. In this example, unlike part 1, the third order polynomial order was used, in which a minimum of 10 points are required to correct the image.  Bilinear interpolation was also used to produce the corrected ouput image, which uses the 4 nearest pixels to estimate the output image's brightness values.

Figure 2 Bilinear interpolation multipoint geometric correction done in ERDAS Imagine of Sierra Leone 1991. RMSE total of 0.0127 with 13 ground control points.
Conclusion
It was interesting to learn in this lab and corresponding lecture about how satellite images need to be corrected due to systemtatic and non systematic errors, such as equipment operation or natural earth tendencies. Learning to use ground control points was fascinating, I prefer the image to map method but I found it interesting to note that the higher the polynomial model and the more ground control points, the harder it is to reduce the root mean square error.

Wednesday, October 30, 2013

Lab 4 Miscellaneous Image Functions


 Goals and Background
                The goal of lab 4 was to explore miscellaneous image functions that can be used in remote sensing techniques to present and enhance remotely sensed images. For this lab the class explored using ERDAS Imagine 2013 software. The techniques used included image subset, pan-sharpening, Google-Earth connection, and resampling. These techniques allow users to optimize visual representation by delineating study areas and enhancing the image and its properties.
Methods
                Part one of this lab included creating an area of interest from a study area by performing an image subset. There are two methods used to create a subset, the first is simple and uses an inquire box to select a specified area. The second method, which can be seen in Figure 1, creates an area of interest based upon a shapefile, or boundary that is based on an ArcGIS file. For this example we used the shapefile that covers Chippewa and Eau Claire counties.
                Part two covers image fusion, and in this section we used ERDAS Imagine to create a higher resolution image in a technique called pan-sharpening. The “Pan” in pan-sharpening comes from the word panchromatic. In an image fusion, two images are combined to create a new output image. In this case, the panchromatic image is of a higher resolution (15m by 15m for landsat images) than the false color infrared image (30m by 30m). Fusing the two images creates a sharper more refined image. This method is often used in applications such as Google Earth to enhance images. Figure 2 in the results section shows this technique.
                Part three involves radiometric enhancement techniques. These can be used to correct haze in an image. Haze can cause the image to become washed out, by performing the haze reduction tool in ERDAS Imagine we can correct this. Correcting for haze reduction enhances the image by creating an output image that has more saturation and contrast. Figure 3 is an example of haze reduction.
                Part four of this lab allowed us to explore how ERDAS Imagine software can interact with Google Earth to compare images or create an image interpretation key. Since Google Earth has a higher resolution, through data collection and pan-sharpening techniques, its images can often be used to help interpret lesser                quality images that might be obtained through remote sensing. Figure 4 shows how we can use ERDAS Imagine to connect to Google Earth and create a linked view of the same area. In remote sensing often an image interpretation key is used to identify images. Two types of keys can be used, a selective key or an elimination key. An elimination key uses a flowchart to eliminate possible objects. Google Earth is more of a selective key, because it allows us to compare similar images to identify our study area.
                Part five is focused on the resampling tool. Resampling allows us to change the size of pixels, which does not change the spatial resolution. There are two forms, resample up and resample down. Resample up reduces the size of the pixel to create a large file, resample down increases the pixel size creating a smaller file. For this lab we compared two methods in ERDAS called nearest neighbor, and bilinear interpolation. I will admit that I am still a little confused at resampling and hope to explore this technique further. Figures 5 and 6 show this technique.
Results

Figure 1 Screen capture of a subset image. Eau Claire and Chippewa county boundaries were used to create a shapefile that outlines this area of interest.
Figure 2 Result of pan-sharpening an image. The image on the right is pan-sharpened and has a higher resolution.
 
Figure 3 Example of haze reduction. The image on the right has had the haze reduction tool performed and appears more saturated in color and has more contrast.

Figure 4 A synchronized view of ERDAS Imagine (left) and Google Earth (right). Google Earth has a higher resolution and can be used as an image interpretation key.
Figure 5 Difference in pixels between input image (left) and bilinear interpolation resampled image (right) which was reduced from 30m to 20m pixel size.
Figure 6 The input image is on the left and the two resampled technique images are on the right. I noted in red the pixel edges. I believe the resampled image has a coarser pixel edge than the original.


 Conclusion

      Overall learning the various miscellaneous image functions was a great exercise. I enjoyed throughly learning how to pan-sharpen an image as well as use google earth to synchronize views and use as an interpretation key. All of the techniques are useful and will prove to be beneficial in future assignments.

Introduction

Welcome to my Remote Sensing class blog! In this blog I will be documenting my lab exercises for Geography 338 - Remote Sensing of the Environment starting with Lab 4 as the previous labs are introductory in nature.

Thank you for tuning in! Be sure to check out my other blogs for other classes!

Emily.